

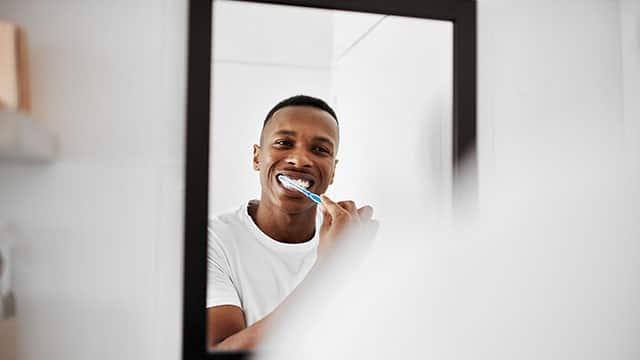
Your white smile is your superpower
How can we help you today?


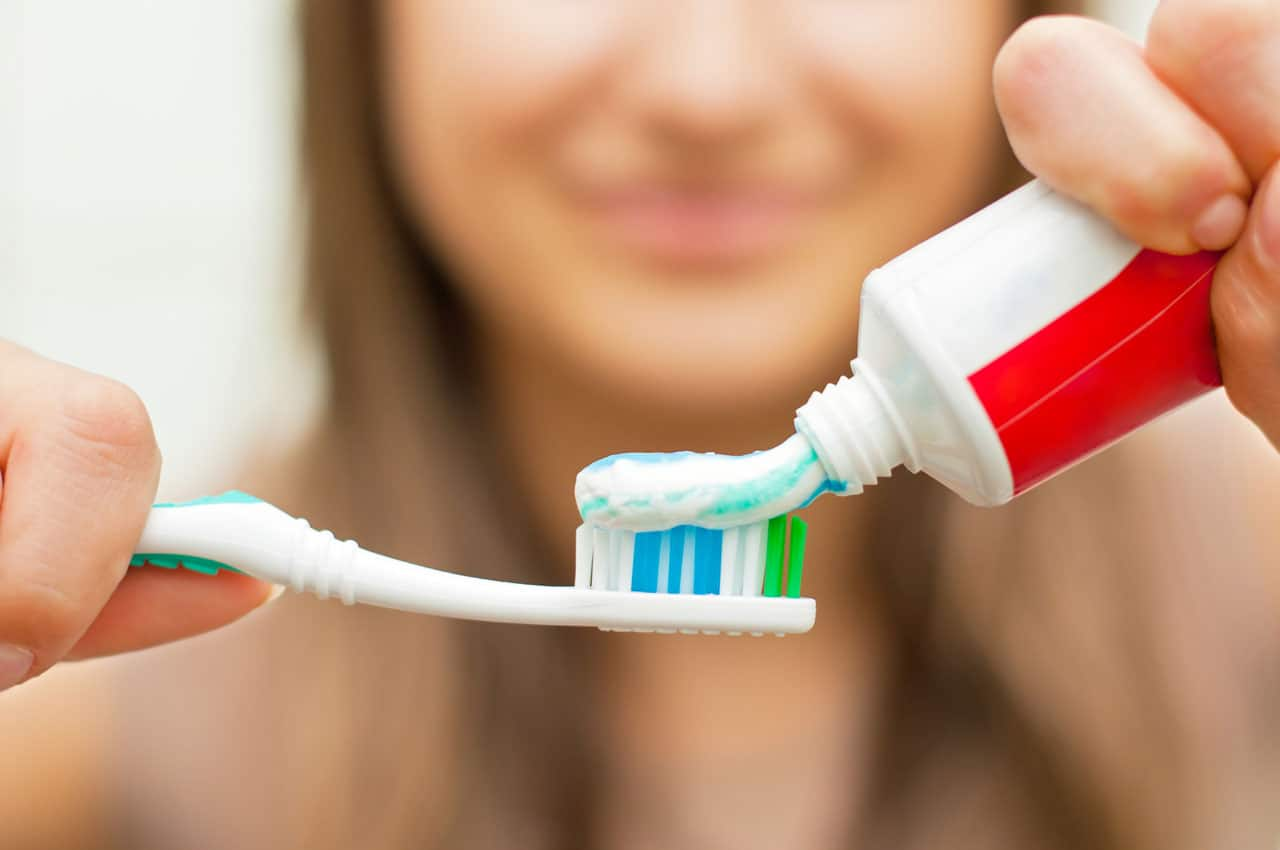
Restore your smile
How can we help you today?


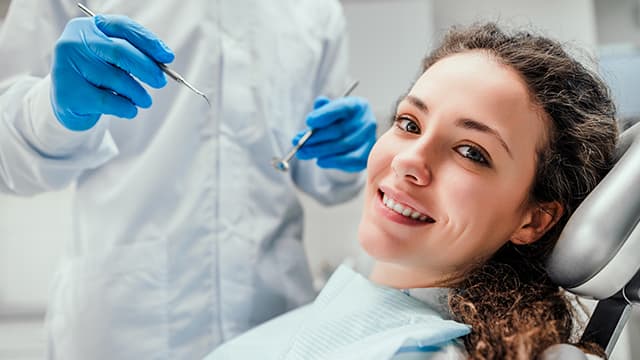
Your smile – worry-free
How can we help you today?


Never have to worry about your oral health
How can we help you today?


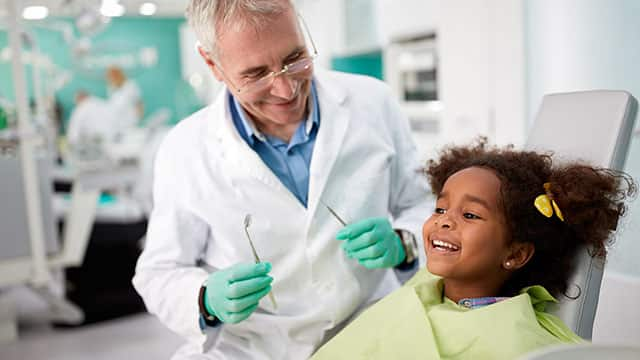
Healthier smiles for the whole family
How can we help you today?


Confidence has never looked this good
How can we help you today?


Energize your smile
How can we help you today?
Products & solutions
- Featured
- Whitening
- Gums
- Kids
- Cavities
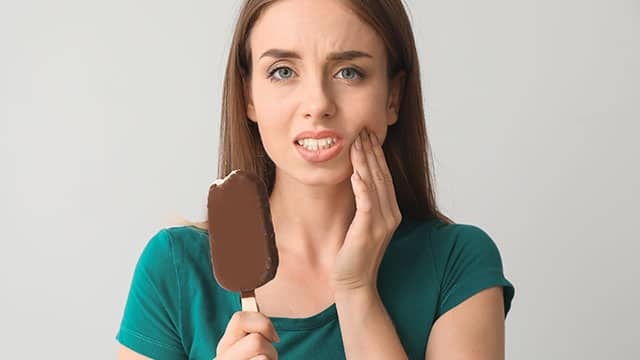
- Sensitivity
- Enamel


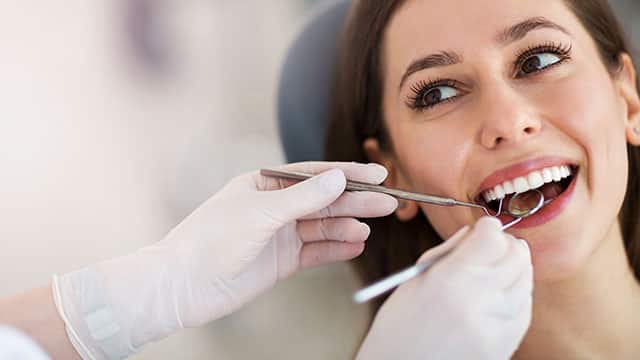
ORAL HEALTH CHECK
What's behind your smile?
Take our Oral Health assessment to get the most of your oral care routine.
ORAL HEALTH CHECK
What's behind your smile?
Take our Oral Health assessment to get the most of your oral care routine.
Oral health topics
- Featured
- Whitening
- Gums
- Kids
- Cavities
- Sensitivity
0 results


.png)
.png)

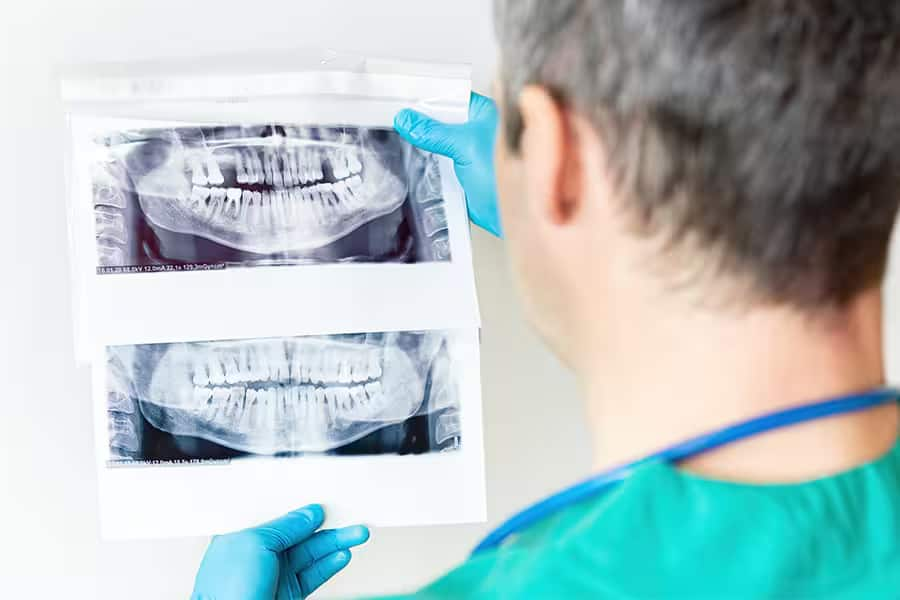


Helping dental professionals

How we create healthier smiles for all
All of our science, expertise, knowledge of oral health, and our partnership with the dental profession and organizations is in service to helping everyone do the best for their smile and the best for the planet too.

SCIENCE & INNOVATION
Changing the world, one breakthrough at a time
Our team of scientific experts develop cutting-edge technology to create the best products and solutions for your smile.

Oral Health Commitment
Leading the way for healthy smiles across the world
Our goal is that every person not only knows how to care for their smile but also has access to oral care products and services.

Environmental Impact
We’re committed to reduce our environmental impact
We recognize the impact we have on the environment and do our utmost to protect the planet.